
Ranter
Join devRant
Do all the things like
++ or -- rants, post your own rants, comment on others' rants and build your customized dev avatar
Sign Up
Pipeless API
From the creators of devRant, Pipeless lets you power real-time personalized recommendations and activity feeds using a simple API
Learn More
Comments
-
I don't think displaying charts is dependent on the backend much right?
I think the order goes about this: ChartJS -- Highcharts -- Plotly -- D3, that is from a very simple graph solution where you have limited control/customization options, to a very flexible but more complex library which requires more coding for each graph.
For some purposes I actually do prefer backend rendering, in which case I tend to use a python lambda/cloudfunction, together with the very powerful matplotlib module. -
The advantage of JS libs is that it's easy to just set up an API endpoint which provides the JSON graph data, and dynamically update the graph continuously (using a repeating API call, or sexier: using websockets). You can animate the graph, and let it respond to user input events, like filtering & zooming.
The advantage of backend rendering is performance & compatibility. You can dump renders as PNGs to be included in the page (for max device compatibility), or go as crazy as inlining minified SVG snippets straight into a minimalistic plain HTML page (for max performance).
Of course, backend rendering is only suitable for non-dynamic historical data, such as periodically generated reports/infographics. -
@PrivateGER Most of the time, but it depends a bit on the target audience, and method of delivery.
For all we know, Wombat is using a Laravel backend to distribute PDF reports full of bar charts, or needs to show a plot on an e-ink display connected to an Arduino which connects to a Laravel server. 😛 -
 Wombat106204y@bittersweet @alexbrooklyn @PrivateGER yeah sure, of course the obvious solution is to use front end js frameworks. But I also found Laravel packages or wrapper like Lavacharts or Larapex Charts.
 -
@Wombat I personally would advise against those, unless you know for sure you will always use Blade.
Most Laravel projects eventually dump Blade in favor of an API and separate frontend, and packages which tightly couple backend and frontend together will get in the way. -
Wombat106204y@bittersweet I didn't know that I am bound to blade when using them. 🙄 I use pug.... so fuck them.
-
@Wombat Yeah I usually stick to the principle that frontends (plural, I consider mobile apps and third party API consumers "frontends" as well) are 100% responsible for presentation.
That means your data is provided by an API endpoint — and the frontends are free to choose what they do with that data. Maybe you want a D3 bar chart in the browser, but prefer a native Java Anycharts bar chart on Android. Or maybe one frontend just wants the raw data to display in a table. -
Wombat106204y@edw1o1 What do you mean by Apexcharts? Should I avoid them? Do they cause cancer? Can I get pregnant by them? I am confused and concerned.
-
 edw1o14374y@Wombat dude, your question literally asks for a recommendation, I use apexcharts in my projects because they look modern, large variety of charts, multiple integration(js, angular, vue, react, php , etc...)


Related Rants


 As a PHP Developer, *heavy breathing*
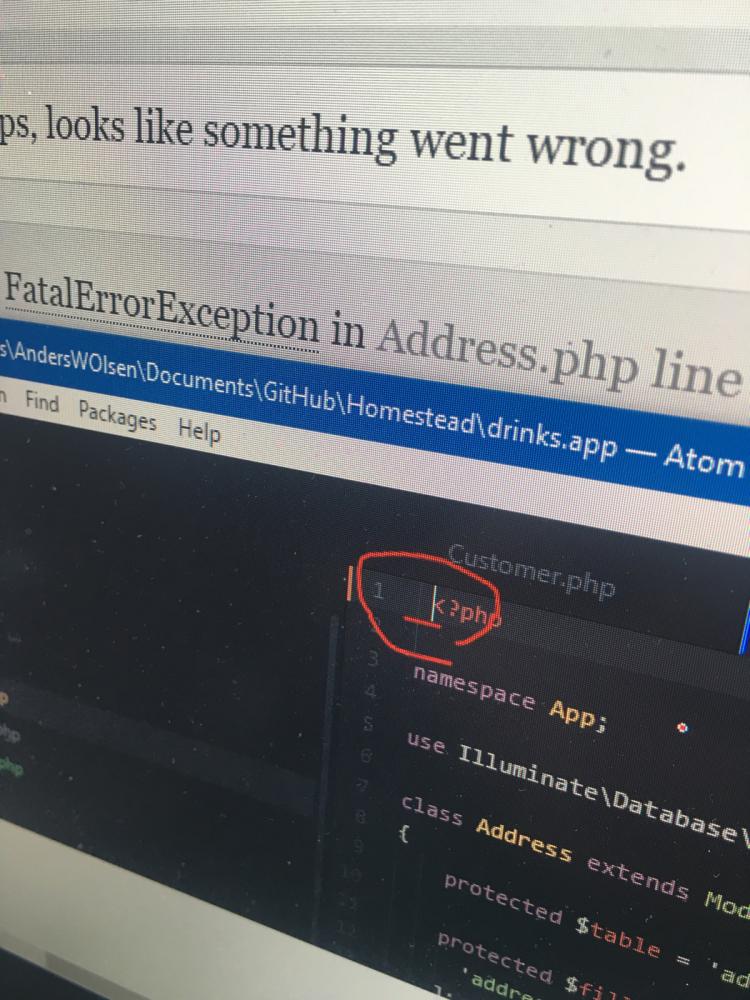 This SINGLE space just broke my entire project. Good luck debugging that one...
What package do you recommend for charts with Laravel?
question
packages
bar charts
laravel